In the dynamic landscape of project management, effective planning is the cornerstone of success. One indispensable tool that has stood the test of time is the Gantt Chart. Developed by Henry L. Gantt in the early 20th century, it has evolved into a fundamental instrument for project planners and managers across various industries. As we delve into the intricacies of project planning, this article explores the significance, components, and real-world applications of Gantt Charts, shedding light on their pivotal role in achieving project milestones and fostering organizational success. Join us on a journey through the timelines of project management, where Gantt Charts emerge as a beacon for efficient planning and execution.
What is the Gantt Chart?
A Gantt chart is a popular project management tool that provides a visual representation of a project schedule. It was developed by Henry L. Gantt in the 1910s and has since become a widely used method for planning and scheduling projects. The chart is named after its creator.
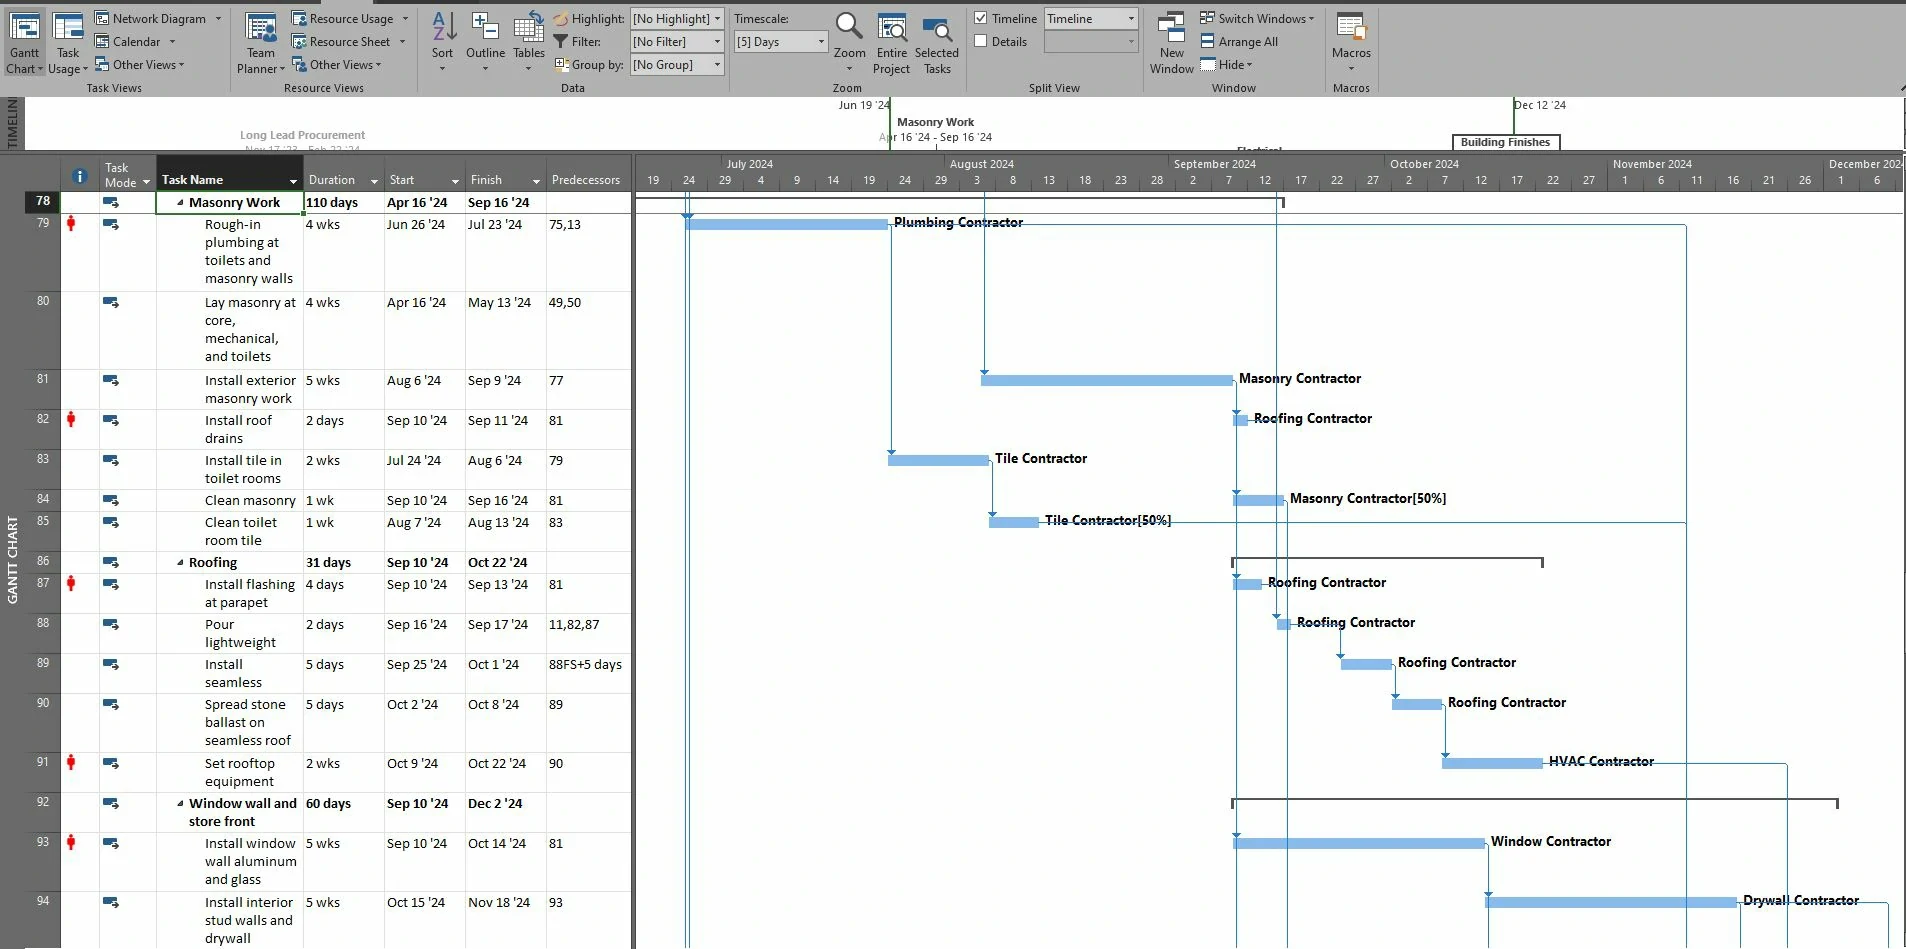
A Gantt chart displays a project timeline along with the associated tasks and their dependencies. It consists of horizontal bars, each representing a task, and their length corresponds to the duration of the task. The chart also illustrates the start and finish dates of each task, allowing project managers and team members to see the overall project timeline and identify dependencies between tasks.
History of Gantt Charts
The history of Gantt Charts can be traced back to the early 19th century, specifically the mid-1890s, when Karol Adamiecki, a Polish engineer managing a steelworks in southern Poland, crafted the initial Gantt chart. Driven by his interest in management concepts and techniques, Adamiecki pioneered the development of this innovative tool.
Approximately 15 years after Adamiecki introduced his version, Henry Gantt, an American engineer and project management consultant, developed his iteration of the chart. Gantt’s version gained widespread recognition and popularity in Western countries, ultimately leading to his name becoming synonymous with charts of this type. Gantt developed the Gantt Chart as a visual method to represent project schedules. The charts featured horizontal bars representing tasks and their durations, providing a clear overview of project timelines and dependencies.
Originally used on paper or blackboards, Gantt Charts gained prominence during World War I for military logistics and manufacturing. Their simplicity and effectiveness in coordinating complex projects contributed to their widespread acceptance. As technology advanced, Gantt Charts transitioned to digital platforms, becoming a standard tool in various industries beyond manufacturing.
Today, Gantt Charts continue to be a fundamental component of project management methodologies. They remain integral to planning, scheduling, and monitoring projects, showcasing the enduring legacy of Henry L. Gantt’s contribution to the field of project management.

Also, read: 5- Types Of Estimates in Construction Projects
Components of a Gantt Chart
The components of a Gantt Chart include:
- Tasks or Activities: The individual components of the project that need to be completed. Each task is represented by a bar on the chart, indicating its duration and position in the project timeline.
- Timeline: The horizontal or vertical axis represents the passage of time and it provides the framework for the Gantt Chart, allowing tasks to be plotted along a chronological scale.
- Bars: Horizontal bars representing the duration of each task. The length of each bar corresponds to the estimated or actual time required to complete the associated task.
- Dependencies: Relationships between tasks that determine their order of execution. Arrows or lines connecting tasks illustrate dependencies, showing which tasks are dependent on the completion of others.
- Milestones: Significant points in the project, marking the completion of a phase or the entire project. Milestones are often indicated to highlight key achievements and track progress.
Common Gantt Chart Variations
- Basic Gantt Chart
- Resource Gantt Chart
- Milestone Gantt Chart
- Summary Gantt Chart
Basic Gantt Chart
This is the most basic form of Gantt Chart which shows the visual representation of a project schedule that uses horizontal bars to illustrate the start and end dates of individual tasks or activities. The chart provides a clear and organized view of the project timeline, making it easier to plan, schedule, and track progress.
Resource Gantt Chart
It is an extension of the traditional Gantt chart that includes information about resource allocation along with the scheduling of tasks. In a Resource Gantt Chart, you not only visualize the timeline of tasks and their dependencies but also see which resources (human, equipment, or other assets) are assigned to each task.
Milestone Gantt Chart
A Milestone Gantt Chart is a specialized type of Gantt chart that emphasizes and highlights key project milestones. While a traditional chart displays tasks and their durations, a Milestone Gantt Chart focuses on significant events, achievements, or checkpoints in the project timeline.
Summary Gantt Chart
A summary Gantt chart is a high-level overview of a project schedule. Instead of displaying detailed tasks, it shows summary tasks or phases of a project. It provides a broad perspective, making it useful for stakeholders and high-level decision-makers who need to understand the overall timeline and progress without delving into the specifics of individual tasks.
Benefits of Using Gantt Charts in Project Planning
Using Gantt Charts in project planning offers a multitude of benefits that contribute to efficient project management. Here are some key advantages:
- Visual Representation of Project Timelines: It provides a clear visual representation of project schedules, making it easy for project managers and team members to understand the overall timeline of the project.
- Identification of Task Dependencies: Gantt Charts depict task dependencies, showing which tasks are dependent on the completion of others. This helps in understanding the critical path and ensures tasks are sequenced correctly.
- Resource Allocation and Management: Assist in allocating resources effectively by displaying when and where resources are needed throughout the project. This prevents overloading or underutilization of team members.
- Improved Communication and Collaboration: It serves as a visual communication tool that can be easily shared with team members and stakeholders. This fosters better collaboration and ensures everyone is on the same page regarding project timelines and progress.
- Monitoring and Tracking Project Progress: Enable real-time tracking of project progress. By updating the chart regularly, project managers can quickly identify delays, bottlenecks, or areas where additional resources may be needed.
- Effective Planning and Scheduling: Charts aid in the systematic planning of tasks and scheduling of activities, helping project managers allocate time efficiently and set realistic deadlines.
- Early Identification of Issues: Allow project managers to foresee potential issues and conflicts early in the planning phase. This proactive approach enables timely adjustments to prevent disruptions.
- Milestone Tracking: Highlight project milestones, providing a sense of achievement and marking key points in the project timeline. Milestones serve as indicators of progress toward project goals.
- Scenario Planning and What-If Analysis: It facilitates scenario planning by allowing project managers to explore different timelines and resource allocations. What-if analysis helps in making informed decisions and contingency planning.
- Historical Reference for Future Projects: Gantt Charts serve as valuable historical records of past projects. Lessons learned from previous Charts can be applied to improve the planning and execution of future projects.
Challenges of Gantt Charts
While Gantt Charts are powerful tools for project management, they do have some challenges and limitations that should be considered:
- Overemphasis on Timelines: Primarily focuses on timelines and scheduling, potentially leading to an overemphasis on meeting deadlines without sufficient consideration for other project aspects.
- Complexity in Managing Large Projects: This can become overly complex and difficult to manage when dealing with large projects that involve numerous tasks and dependencies.
- Inability to Handle Dynamic Changes: It is difficult to adapt to frequent changes in project scope, tasks, or timelines.
- Resource Allocation Challenges: This may not provide detailed insights into resource availability and workload.
- Communication Limitations: Might not be the most effective communication tool for all stakeholders.
- Dependency Complexity: Managing intricate task dependencies can become challenging, especially when projects involve numerous interconnected tasks.
Also, read: Subcontractors: Their Role and Impact on Construction
Limitations of Gantt Charts
- This can result in neglecting the quality of work, team collaboration, and other critical factors essential for project success.
- Managing and updating extensive projects may require significant time and effort, potentially leading to inefficiencies.
- Projects often undergo changes, and if these changes are not seamlessly integrated into the Chart, it can lead to inaccurate representations and planning.
- While it can show task dependencies, they may not adequately address resource constraints, potentially leading to overloading or underutilization of team members.
- Some stakeholders may find it too detailed or complex. Alternative, more visual communication methods might be necessary for a broader understanding.
- Understanding and accurately representing complex interdependencies may be difficult, leading to potential oversights.
FAQs
Q: How do Gantt Charts work?
Ans: It uses horizontal bars to represent tasks or activities, with each bar indicating the start and end dates. The chart also illustrates the dependencies between tasks and the overall project timeline.
Q: What are the key components of a Gantt Chart?
Ans: The main components include tasks or activities, timelines (start and end dates), task duration, and dependencies between tasks. Some charts also include milestones and resource assignments.
Q: What is the difference between a Gantt Chart and a PERT Chart?
Ans: While both are project management tools, Gantt charts focus on timelines and task dependencies, displaying them visually. PERT (Program Evaluation and Review Technique) charts emphasize the relationships between tasks and the critical path of a project.
References:
- Wikipedia contributors. (2023, August 6). Gantt chart. Wikipedia. https://en.wikipedia.org/wiki/Gantt_chart
- Meardon, B. E. (n.d.). Gantt Charts | Atlassian. Atlassian. https://www.atlassian.com/agile/project-management/gantt-chart
![]()


